This particular topic piqued my interest after seeing negative feedback about the quality of tracking on services like AllTrails and Strava. Users often complain about inaccurate routes, inaccurate mapping, “incorrect” elevations, “wrong” distances and more. What I find really interesting about these related complaints is that there are a lot of fundamental misunderstandings about how GPS works, expectations around accuracy, and confusion around how that data interfaces with other applications. So today, I’m going to dive a little bit into how digital mapping systems are built and how GPS works.
”My GPS pinpoint isn’t on the trail”
All maps are lies – or rather, useful distortions of the “truth”. They are two dimensional representations simplified for our understanding and utility. Earth’s surface isn’t perfectly flat, it’s a complex topography on top of a giant disc balanced on the back of four elephants who are standing on the back of the great turtle A’Tuin 😉.
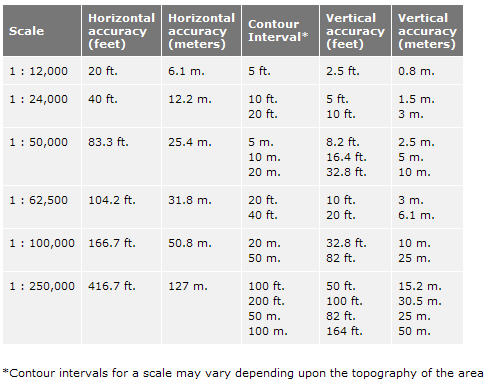
In the same way that we have various map projections for paper maps, digital maps make decisions for us about how to represent data that isn’t actually “flat”. 2D maps must account for visualizing terrain that is wrapped around a sphere-like shape where no lines are truly “straight”, and account for Earth’s slightly fatter middle section. The accuracy standard for USGS maps “requires that the positions of 90 percent of all points tested must be accurate within 1/50th of an inch (0.05 centimeters) on the map. At 1:24,000 scale, 1/50th of an inch is 40 feet (12.2 meters).” At the tightest scale (1:12,000), the standard is still 20 ft. Note, this is the accuracy of our maps themselves, without even accounting for any error on the tracking side of things.
Anyways, that’s all to say that creating a digital map involves a lot of translation between different technologies in order to appropriately render something that we can understand and use.
“Why is my distance wrong”
GPS (Global Positioning System) works by using a network of satellites that transmit signals to a GPS receiver (in this case, your phone, watch or dedicated GPS device). The receiver typically calculates its exact location by triangulating the distance from at least four or more satellites. GPS data from the receiver is passed along to software (apps), and parsed in order to track your movement, recording information like speed, distance, and route. These apps are only as accurate as the data they are fed by the receiver – Strava/Alltrails/etc are not responsible for the raw GPS data.
GPS is incredibly accurate in the sense that we can pinpoint things to an extremely high degree of accuracy at the scale of the Earth. However, it still has a large margin of error when we shrink down to the scale of most running/hiking/biking tracking. Modern smartphones can achieve location accuracy within a range of 5 to 10 meters (about 16 to 33 feet) under optimal conditions. That accuracy can be affected by the number of satellites currently overhead, weather conditions, terrain features, signal bounce in urban areas, and more. If you’re an athlete complaining that your watch or phone only tracked you at 13 miles instead of 13.1 for something you “know” was exactly a half marathon, that’s well within a reasonable margin of error.
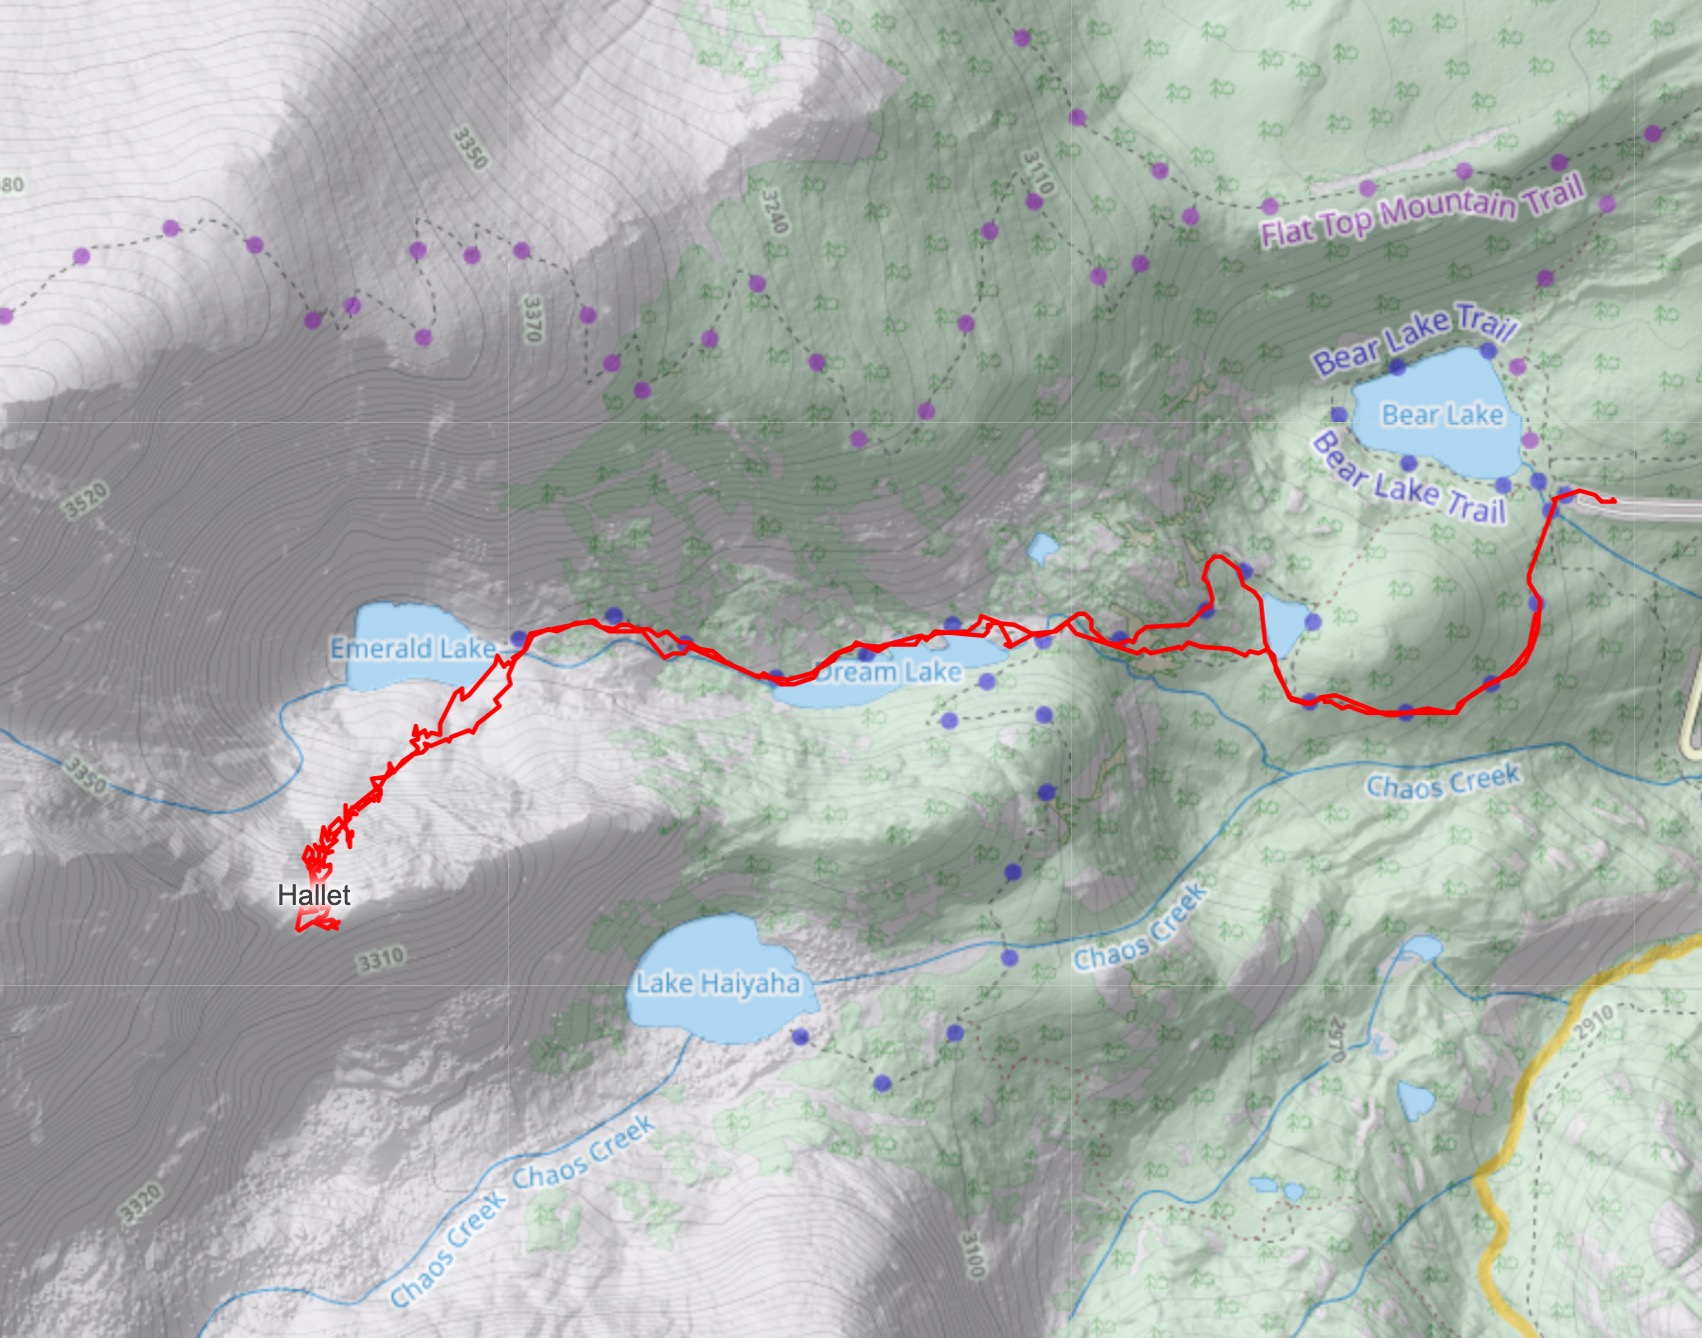
When you track a route with your phone or watch, your series of GPS waypoints are stored as vector lines, and given the degree of accuracy discussed above, the raw data is likely to look like a constant zig-zag. The below track is a raw GPS file tracked using my phone. At a larger scale, it looks like it tracks the trail quite well (when on trail).
But when we zoom in, we can see the amount of variation, even on a clear, well established, mostly straight trail. These “little” variations can quickly add up over longer distances.
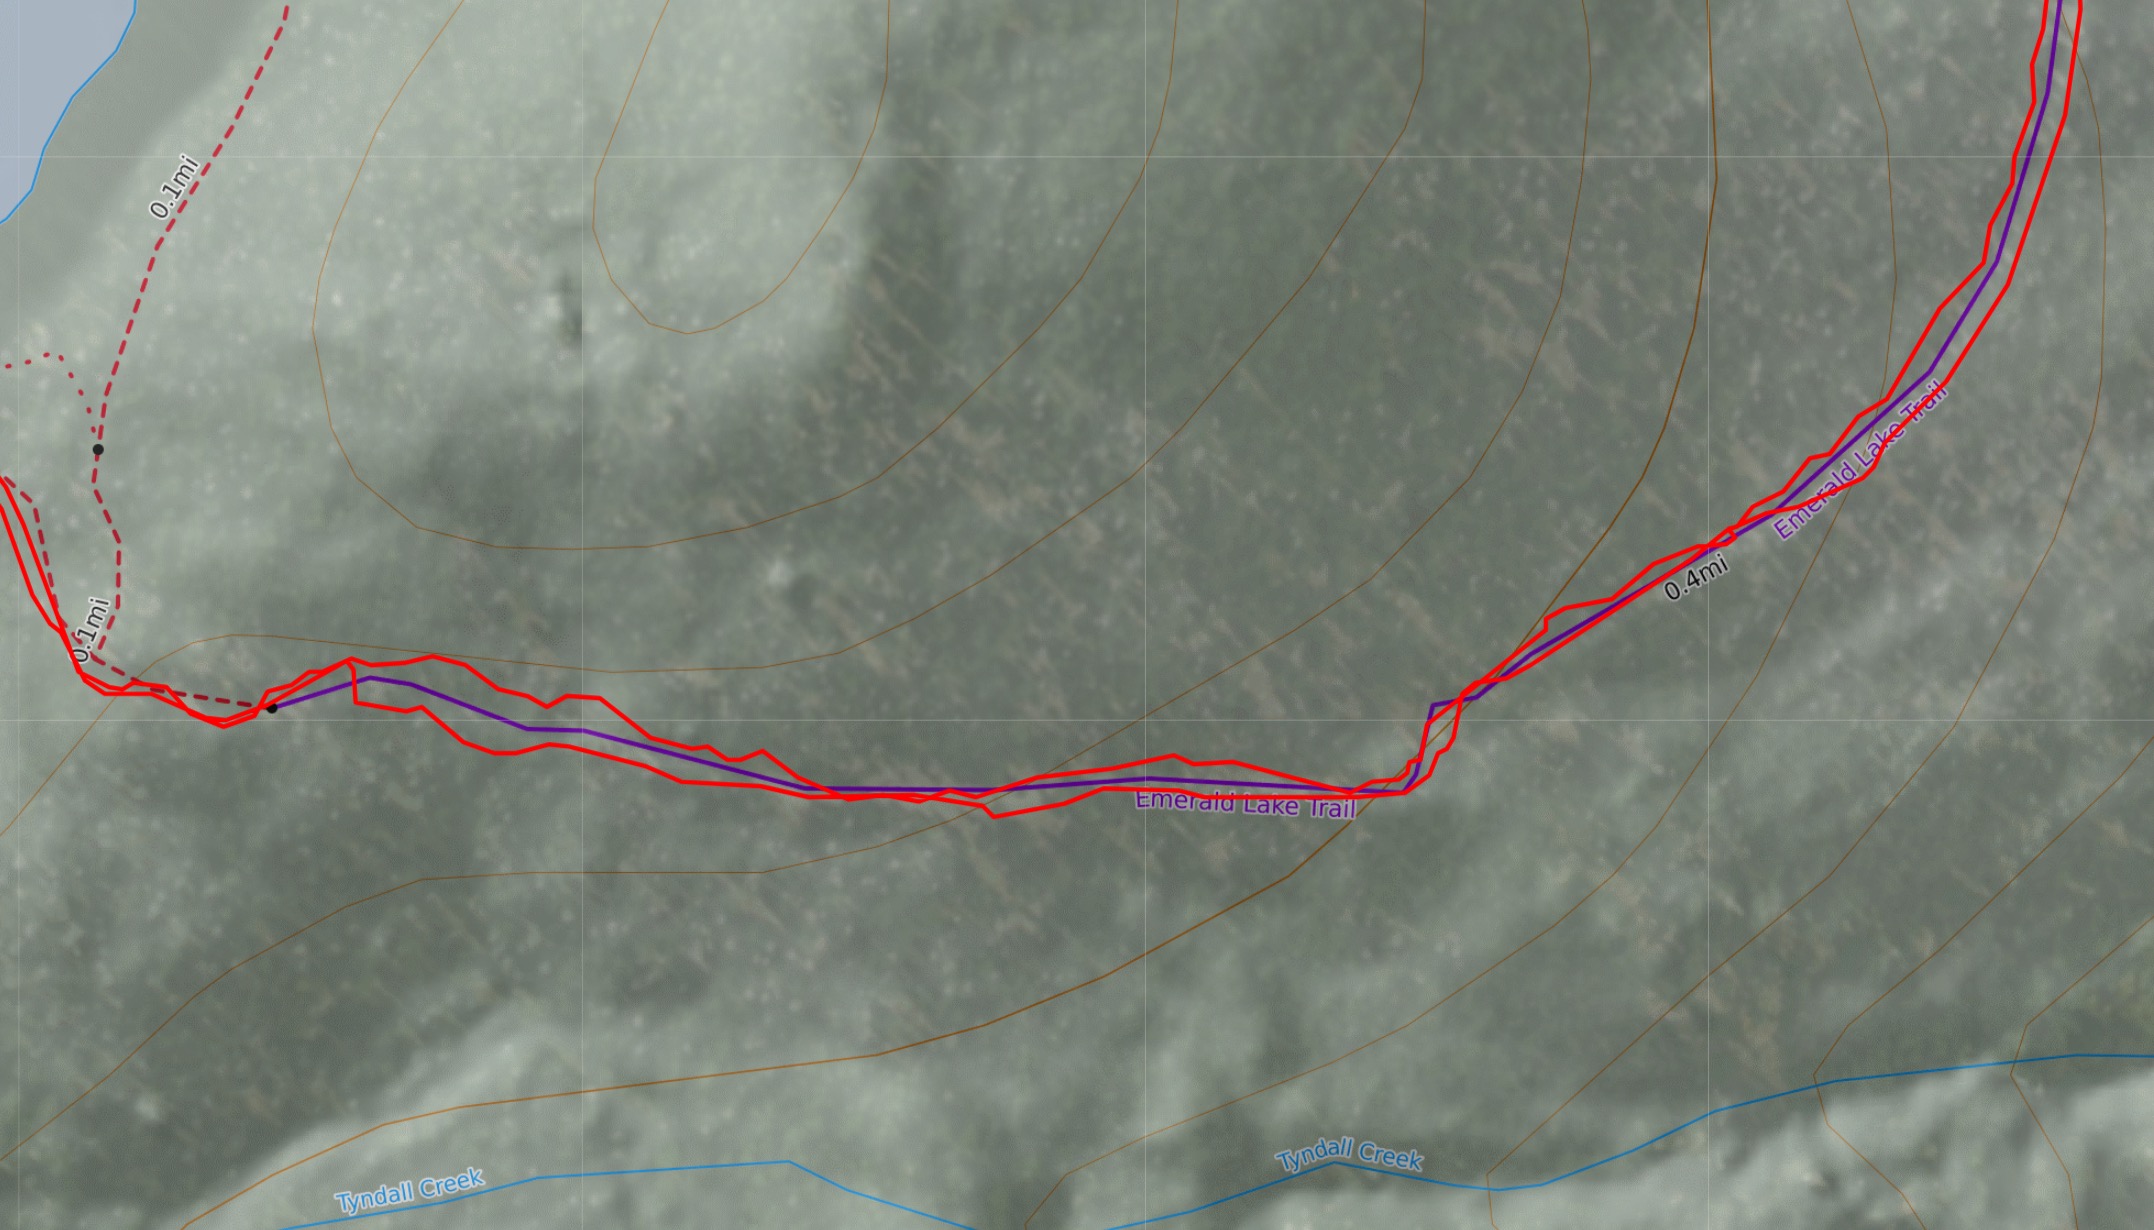
Activity tracking and mapping apps often apply a smoothing algorithm to the raw data, which takes all of these GPS points that may have been tracked as part of your activity and try and guess what you were actually doing. If there are a bunch of tiny variations that zig zag on a known route, the algorithm will “smooth” your route to that trail. It varies by application — Apple and Nike tend to go heavy on the smoothing, while Strava, and Garmin do a bit less (purely anecdotal data). However, this artificial smoothing can also “correct” data that was right in the first place, making it “wrong”. Other apps, like CalTopo choose not to do any smoothing, taking a more philosophical position that using your raw data is more representative than adjusting your data to look nicer and errors are just part of using GPS.
There are a million edge cases. Sometimes you actually do go off the trail – do you want that correctly tracked, or “smoothed” back onto a trail? How long or how many GPS points should be “off” the trail before it isn’t smoothed away? Did you cut a switchback? Did you walk around a trail obstruction? Did you have a section of bad signal coverage that created a huge significant outlier or did you go off the trail to take a shit? There are a lot of funny edge cases that people get really annoyed about and assume companies should “just fix”, but are actually quite hard to identify consistently as true errors. This also accounts for many of the discrepancies between distance/elevation/etc using the same GPX track on different platforms, as each company may choose to address those edge cases in different ways.
”I hiked way more (or less) elevation than this”
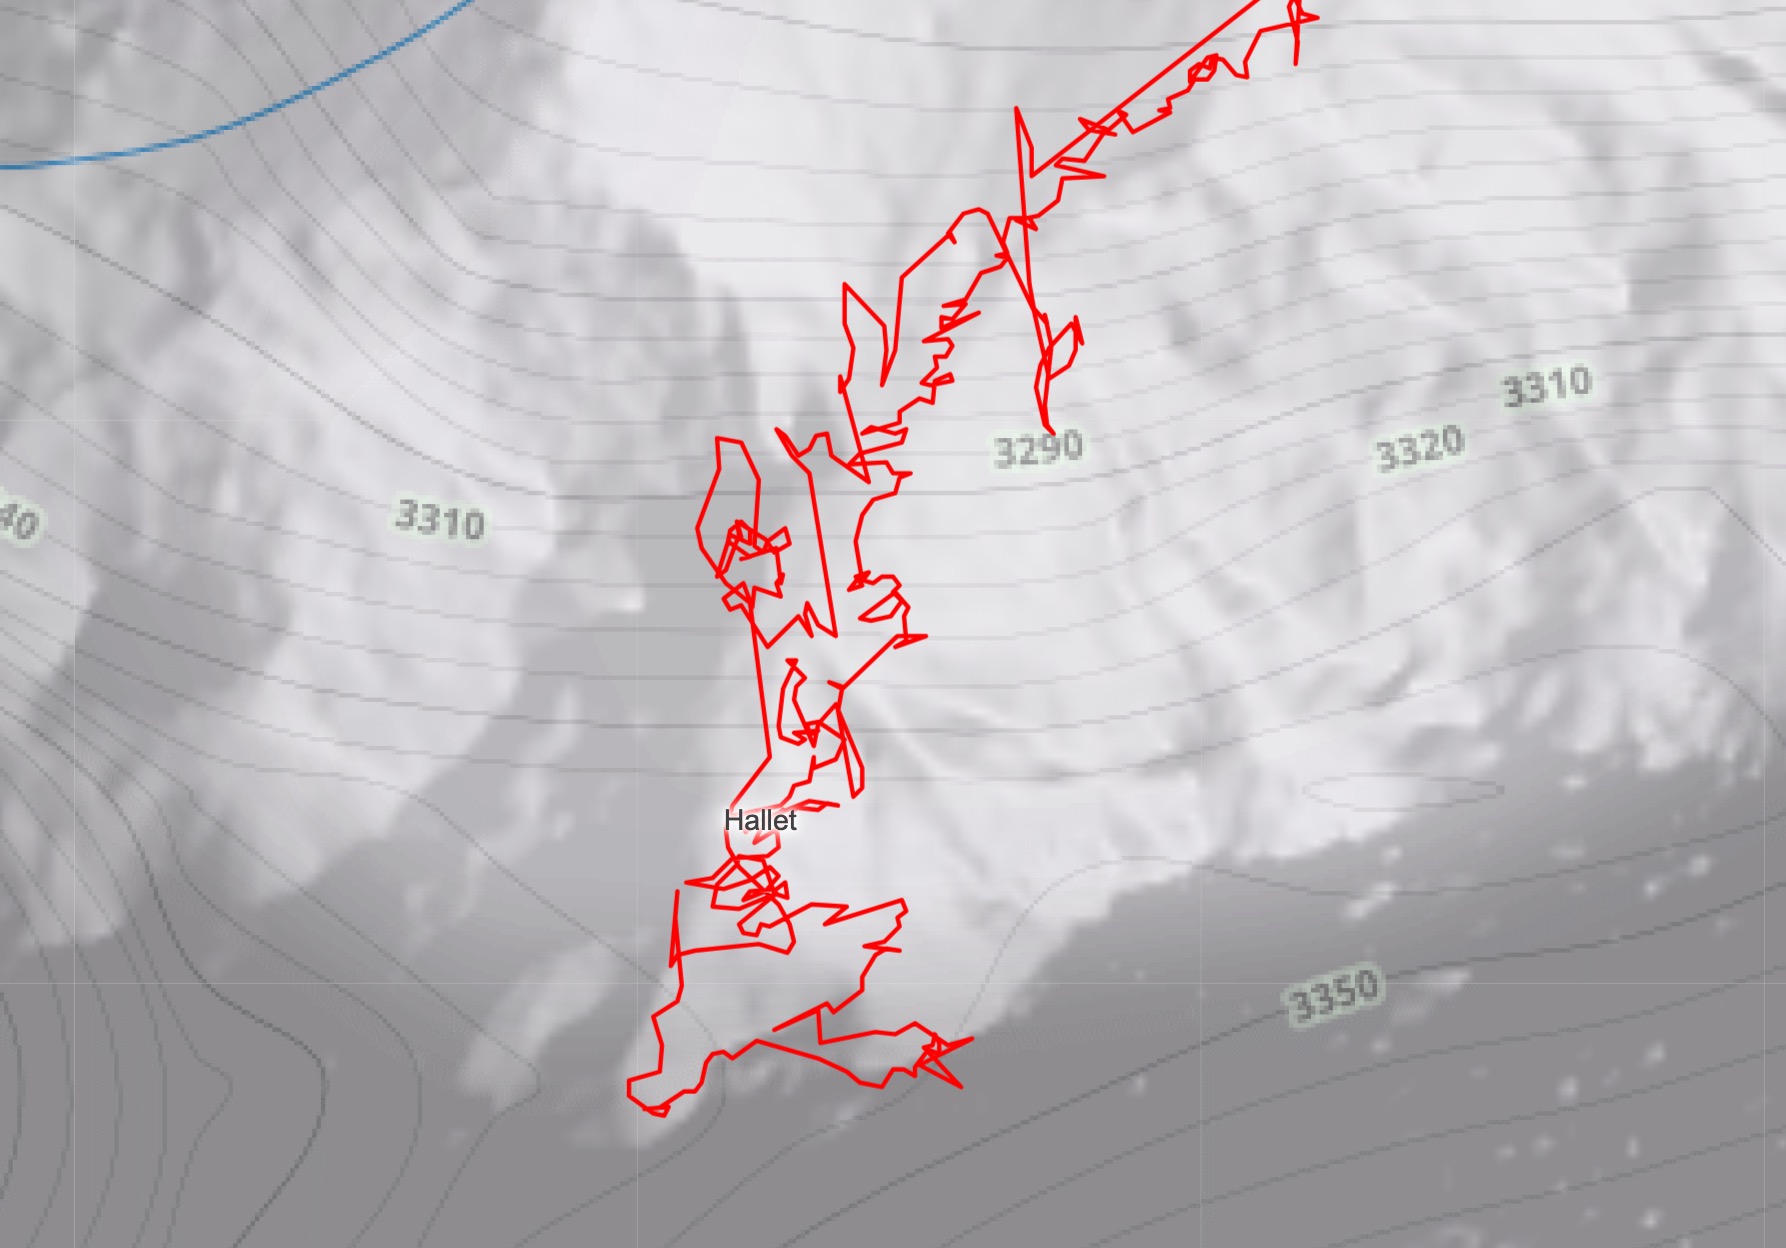
GPS can do elevation calculations, although most applications use a Digital Elevation Model (DEM) because it is often more accurate than using elevations derived from GPS. In locations where the topography changes rapidly, like canyons and steep, mountainous terrain, there can be huge jumps in elevation change over minor horizontal distances. So, if your GPS point is off even a little bit, that could compound into a huge elevation discrepancy. Naturally, this also increases in places where there are less established or no trails, because apps have nothing to try and “guess” your exact route. Some watches also have barometers, which can either automatically or manually overwrite elevation calculations based on GPS in tracking apps. Using that same track as before, we can see how the GPS went absolutely wild as soon as I started climbing and later skiing this steep and narrow couloir.
A DEM is basically a map layer made up of a super tight grid, where each cell has a specific elevation value. This grid is layered with other map data and your route in order to calculate your change in elevation. DEMs can be built from a range of different data sources with varying degrees of accuracy. For example, Strava actually uses an in-house DEM that is built from past user data recorded with barometric trackers. So when someone records a track using a watch with a barometer (highly accurate), Strava will associate those elevation values with the raw GPS data and the smoothed route in order to continue improving their calculations. In areas where no one has tracked before (or without barometers), they continue to use other publicly available DEM data. Is it going to be perfect all the time? No, and it would not have corrected for the above, off-trail problem, but man, it sure is super interesting to see the approaches smart people are taking to try and continually make things more accurate.
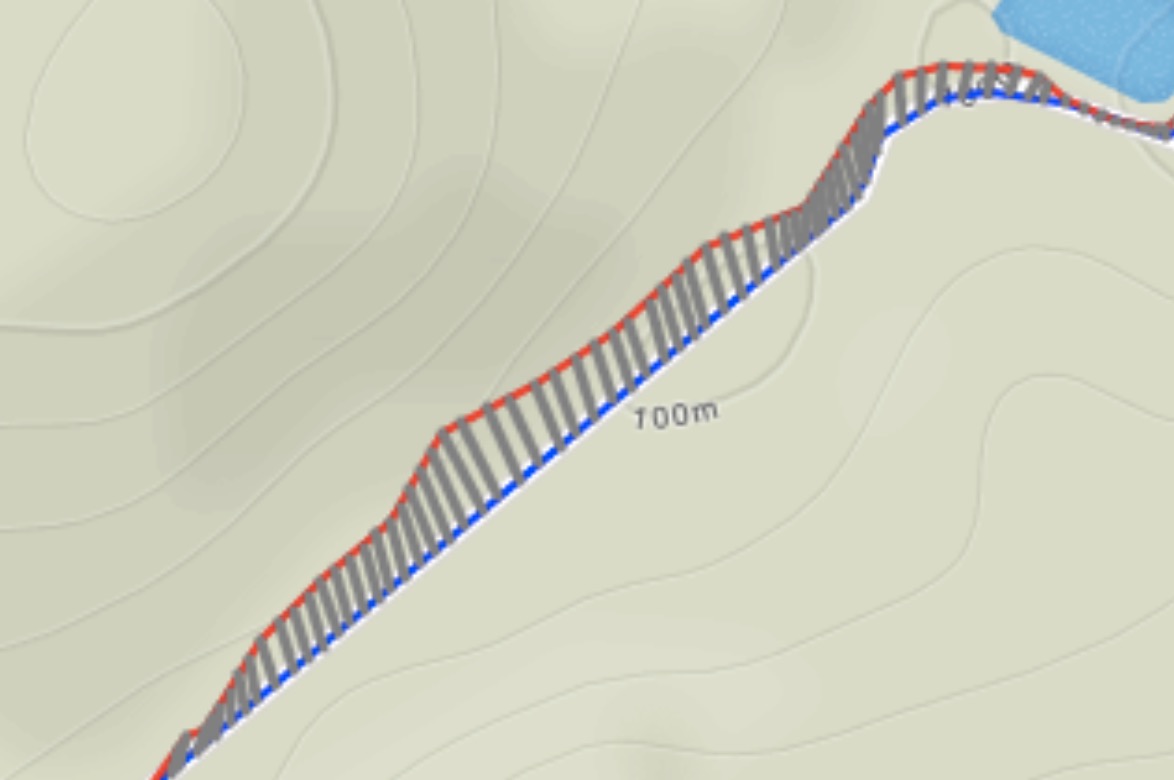
An example of how Strava corrects for GPS drift by utilizing elevation profiles for the trail you’re actually on (track in red, actual trail in blue).
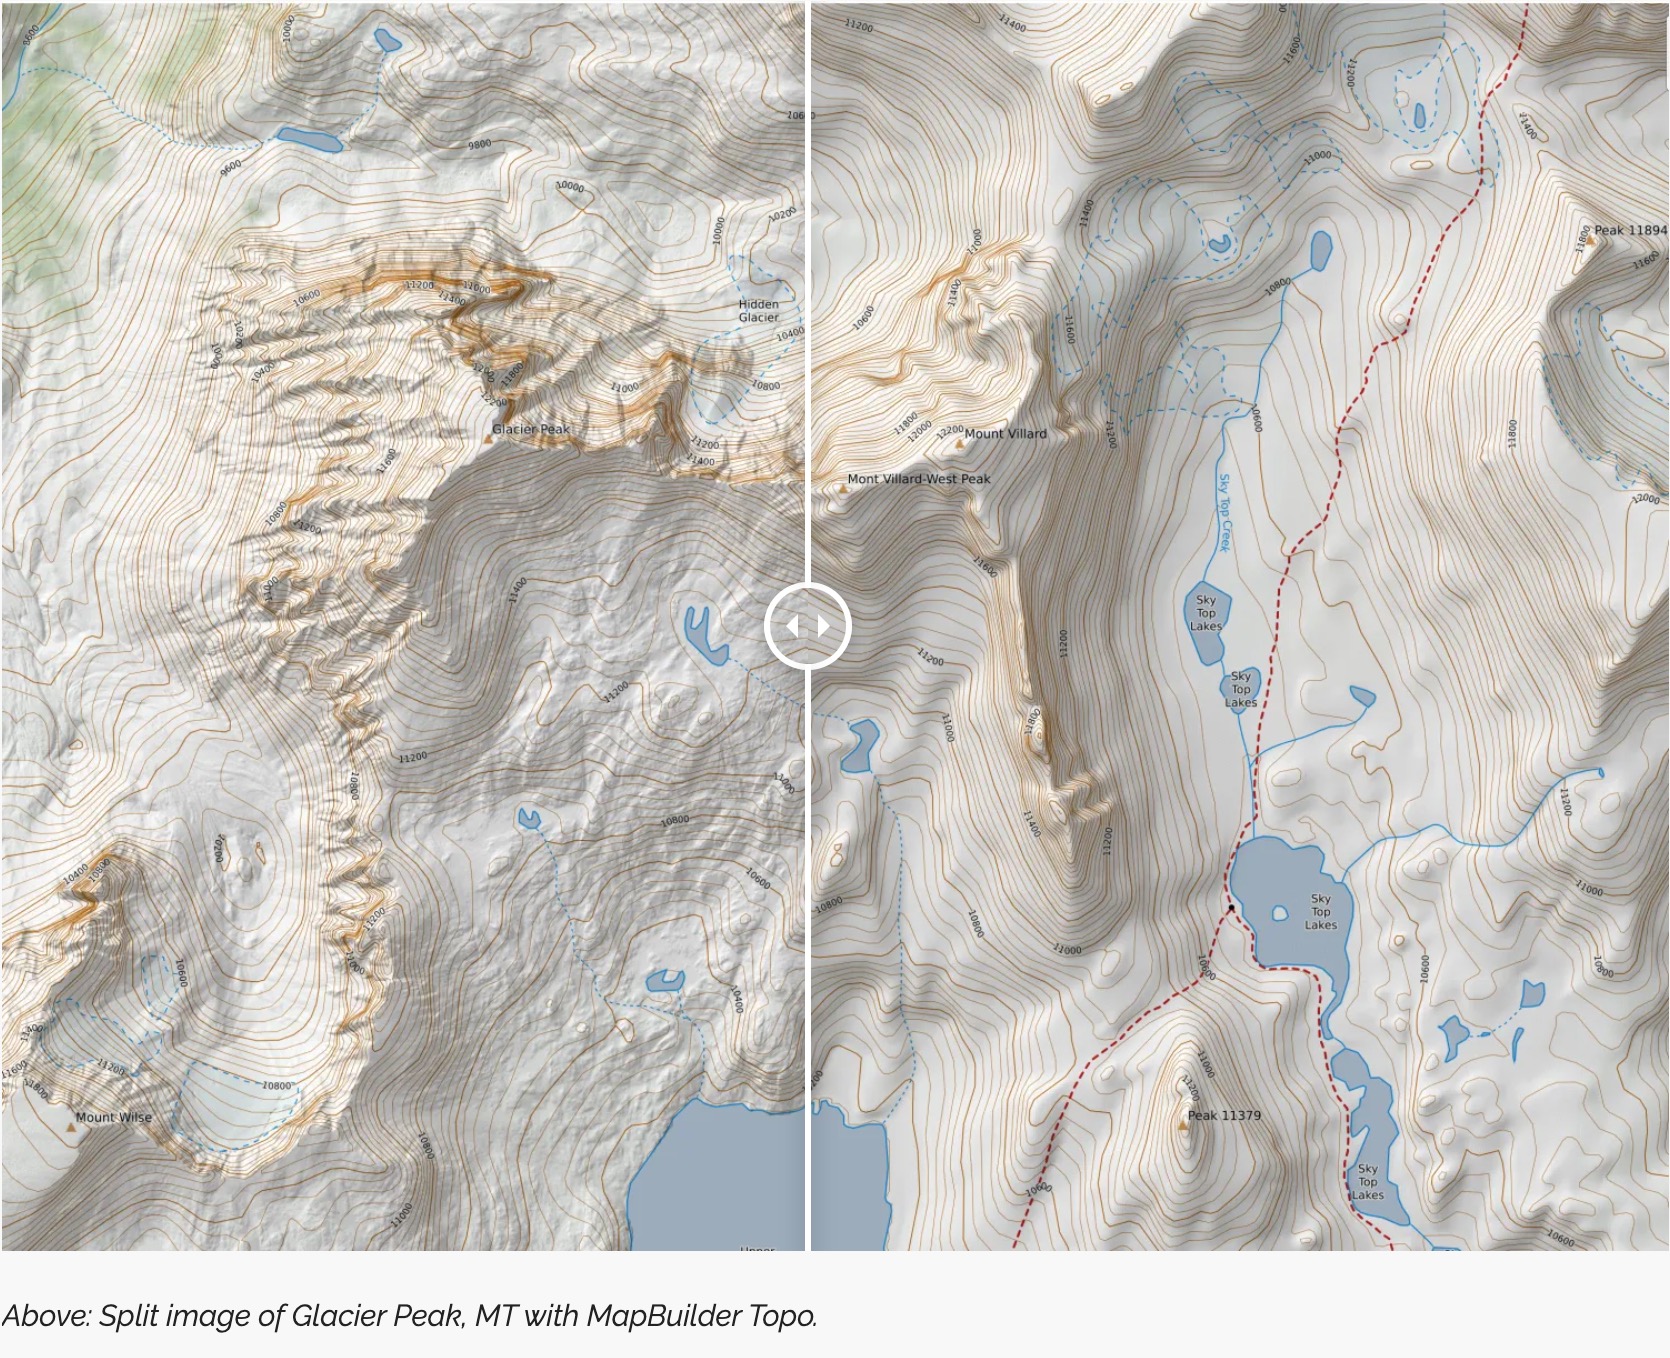
There are also some new technologies in play that haven’t been fully adapted by activity tracking apps (yet). Most 3D maps currently in use are actually just combinations of satellite imagery, and other map data layers extruded using DEMs into a 3D representation. But, Light Detection and Ranging (LiDAR) mapping creates incredibly detailed maps of the Earth’s surface using lasers. The unique aspect of LiDAR is that it can create both a DEM model (the “bare earth”) terrain, AND a Digital Terrain model. Typically planes will fly over an area and send laser (light) pulses down toward earth and measure the time to get a return. The first light to reflect back will bounce off of trees, vegetation, etc and, but some of it will filter through and then return with a minuscule time delta, giving the “bare earth” measurement. However, LiDAR is a time and cost-intensive effort, although more and more areas are being mapped. I expect to see more platforms integrating this data and visualizations in coming years. CalTopo recently integrated more LiDAR data and it’s pretty cool to see the difference in resolution. If you’re technically inclined and interested, the U.S. Interagency Elevation Inventory has a ton of publicly available data.
All of this is a very long-winded way to say that maps and tracking are complicated. And fascinating! Who’s to say exactly what the “right” elevation change or distance of your trail run was? All of our “right” data from planning routes is neatly snapped exactly to trails lines in a mapping application. But, those maps could be slightly off, and your actual running route could be as well. I for one, am not going to be out there with a measuring wheel to see if that 10-mile trail I just ran was actually 10.109 or 9.872 or whatever. I’m sure I’ll inevitably get a few emails from opinionated users explaining to me exactly why Strava is doing this wrong or Garmin is right, or AllTrails is broken and CalTopo is the best. All these platforms are making slightly different philosophical decisions about the trade-offs in maps and tracking. Just enjoy your run/hike/bike, touch some grass, and pay the dang Strava tax if you’re that worried about your segments and “best performances”.


